

*Text in bold has additional explanation of the term which can be seen if you place your cursor over the text.
As we know, the human brain is composed of two distinct cerebral hemispheres, a left-hand side and right-hand side. The left-side of the brain is thought to be, "associated with linear and analytical thought" and the right-side to be, "associated with creative thought and the emotions" (Oxford English Dictionary). Intuitively it would seem that the practice of Data Quality would fall into the left-hand side (In that it is focused more on numbers and quantitative analysis and pattern recognition), and that User Interface Design would fall into the right-hand side due to the focus on artistically appealing design and esthetics. But is it that simple? In this blog post we look at the overlap between User Interface Design and the Representation dimension of the Conformed Dimensions of Data Quality.
--
Earlier in my career, I was a data modeler. Depending on who you talk to, that could mean different things. To data scientists, a modeler is person that develops mathematical models to answer questions- e.g. How many widgets am I most likely to sell next month. To a computer scientist, data modeling is the process of developing a series of conceptual, logical, and physical models. In this role, I was taught that I always needed metadata (starting with business defined descriptions for each entity (table) and attribute (column) of my model. From this perspective, having Metadata Available was essential to the audience, whether it be the business analysts (who wrote the business requirements), the business stakeholders (who funded the application development) or the backend developers (who ensured that the application handled all of the typical functions [create, read, update, delete, often fondly referred to as CRUD]).
Now, if you come from the IT side of the house, then you’ll identify with these reasons for creation and maintenance of descriptions and documentation (metadata). Now if you come from the business side of the house, (sales, marketing, finance, operations...etc.) you just know good Web sites and applications when you see it. To the layman, it's like Apple products, we know that we like them because they are simple and intuitive. It seems that every four years, when the Olympics are held, the announcer often says that the Olympians "make it look easy" but in reality making something simple and yet valuable can be difficult.
So I decided to look around and see what it takes to develop a great User Interface. I found a helpful blog, and observed that Lynda.com (now LinkedIn.com) has over 600 courses on Web Design, and over 100 on Web Development. In addition, the DMI Design Value Index (a US stock market index of design oriented companies) has shown that, over a 10 year period, design-focused companies have a 228% better return than the S&P.
Here is the connection. If you want your company to out perform the market, it needs to be both data-driven and design focused. What better way to fuse these two objectives than to incorporate the areas of overlap. That overlap falls within the Representation dimension of data quality.
Definition of the Dimension- Representation measures ease of understanding data, consistency of presentation, appropriate media choice, and availability of documentation (metadata). [release 3.3]
The definition above is crafted to provide an umbrella description of high quality data presentation. The Underlying Concepts below provide concrete subject areas that can be measured in order to assess whether your organization has presented data in the most effective light.
Underlying Concepts:
- Easy to Read & Interpret
- Presentation Language
- Media Appropriate
- Metadata Availability
- Includes Measurement Units
The other day, while purchasing some services online, I came across a Web form that uses helpful and potentially legally critical information. When registering a company to do business in a US State, a useful and comprehensive business description is required by some States (see warning below for the District of Colombia, Massachusetts, and South Dakota). On the Web form, shown below, a handy circular question mark button is available and when I hover-over it with my cursor, the following hint appears.
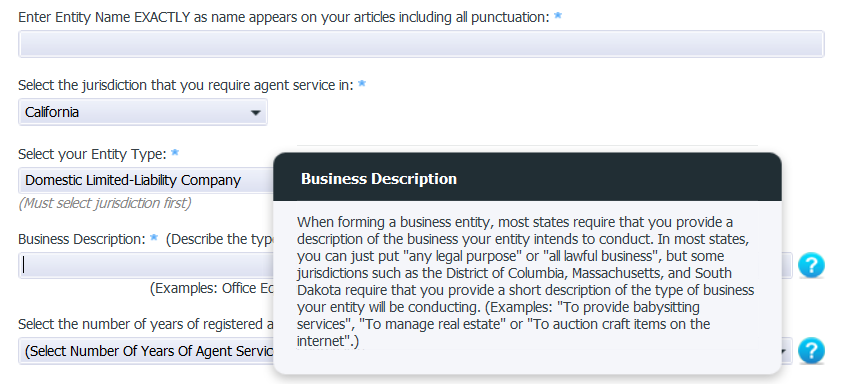
Technically this is metadata. The information provided is describing the input data that you are providing in the form. This is an great example of exceptional Representational data quality. I was impressed with this company’s attention to detail that helped me. This is how your organization can engender appreciation and value for your customers (not to mention your own value-add to your employer). By providing similar descriptions, within your organization's applications, you are improving data quality!
Question for thought (and feedback): What types of metadata is your organization collecting and providing data consumers in an effort to improve understandability and ensure effective communication? Email me a few examples at dan[at]DQMatters.com. |